

October 2025 brought steady activity and balanced conditions to the Vancouver Island real estate market. The Vancouver Island Real Estate Board (VIREB) reported moderate year-over-year declines in sales, small shifts in inventory, and benchmark prices that remain relatively stable across the region. For buyers and sellers, balanced market conditions continue to offer solid opportunities.
October 2025 Market Overview
VIREB recorded 649 unit sales across all property types in October 2025. This represents a nine per cent decrease compared to October 2024. Active listings also shifted slightly, landing at 3,838, which is four per cent lower than the same period last year.
Balanced inventory levels—approximately six months of supply—are helping keep the market steady. VIREB CEO Jason Yochim notes that these conditions create strong opportunities for both buyers and sellers.
Single-Family, Condo, and Townhome Sales
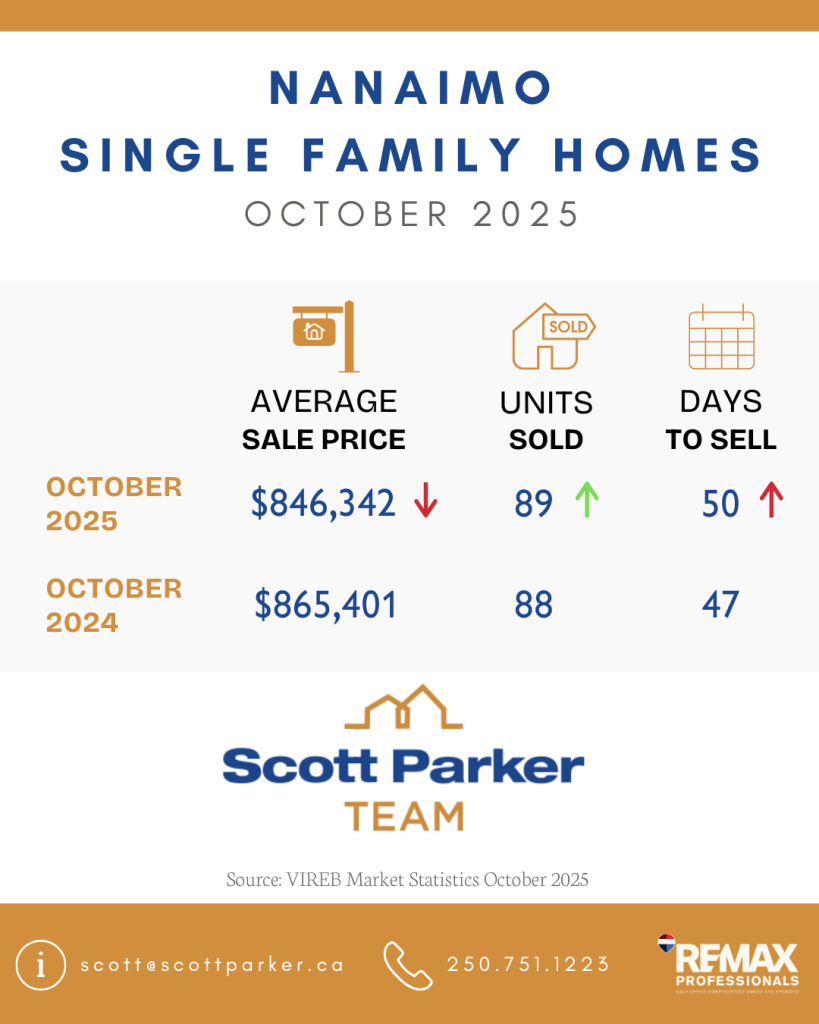
Single-Family Homes
- 317 units sold in October 2025
- Down 8% compared to last year
- Up 3% compared to September 2025
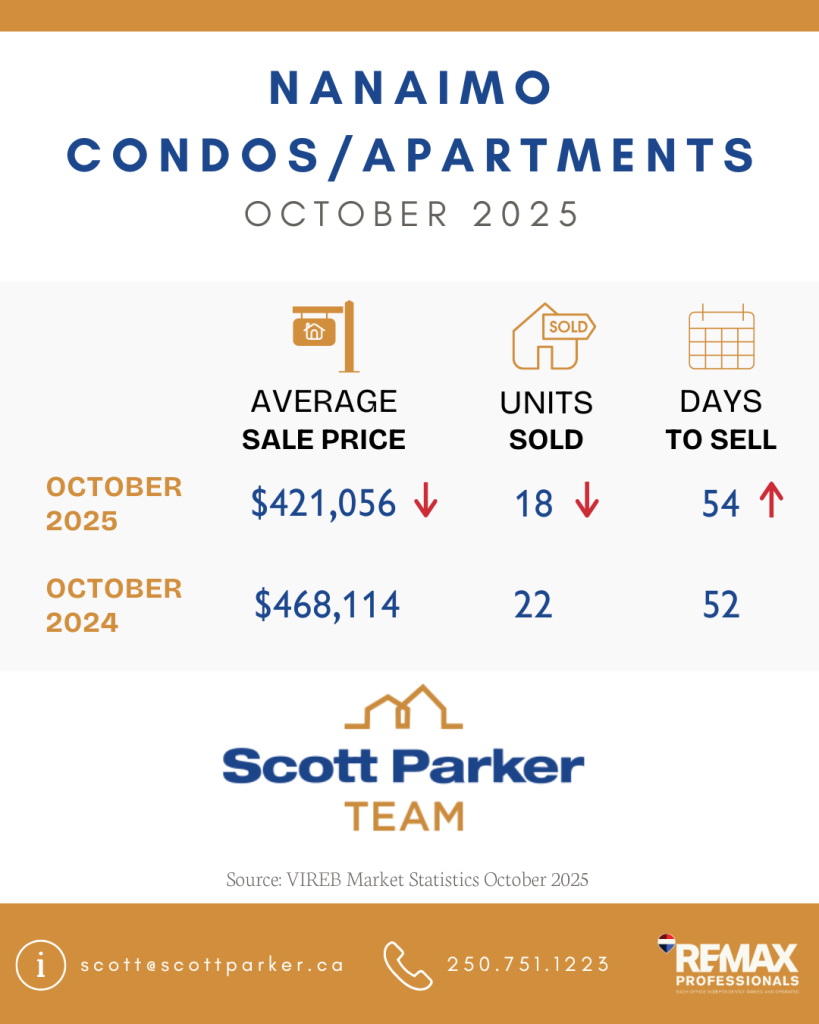
Condo Apartments
- 69 units sold
- Down 13% year over year
- Up 17% from September
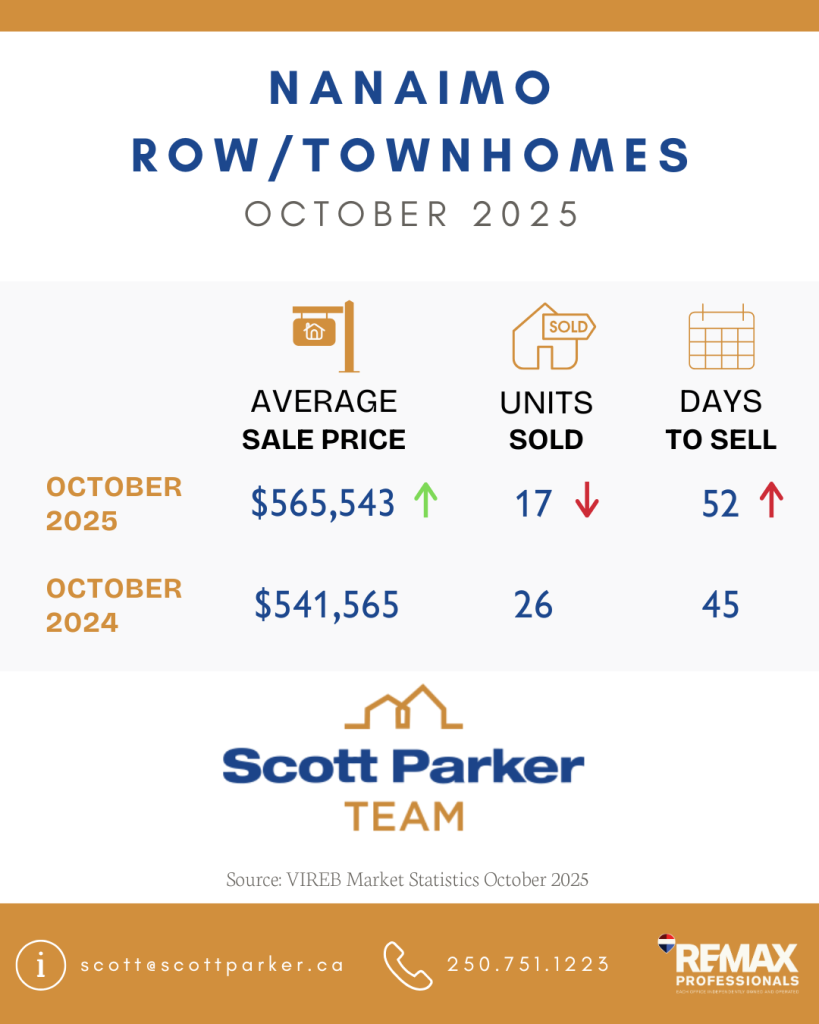
Row/Townhomes
- 78 units sold
- Down 6% year over year
- Down 1% from September
These numbers show a slight cooling year over year, but monthly momentum is improving in several categories.
Active Listings by Property Type
Inventory remained relatively stable throughout October:
- Single-family homes: 1,224 listings (down from 1,352 in October 2024)
- Condo apartments: 362 listings (down from 366 last year)
- Townhomes: 319 listings (up from 299 in October 2024)
Lower inventory levels help support price stability across most regions.
October 2025 Benchmark Prices (MLS® Home Price Index)
Board-Wide Overview
- Single-family homes: $795,900 (up 2% year over year)
- Condo apartments: $411,700 (up 4% year over year)
- Townhomes: $542,900 (down 1% year over year)
Prices slipped slightly from September but remain generally higher than one year ago.
Benchmark Prices by Region
Campbell River
- $704,200 (+1% from 2024)
Comox Valley
- $859,100 (+3%)
Cowichan Valley
- $803,700 (+5%)
Nanaimo
- $813,900 (+1%)
Parksville–Qualicum
- $920,700 (+3%)
Port Alberni
- $521,000 (+4%)
North Island
- $464,600 (+8%)
Across Vancouver Island, most communities saw steady year-over-year price growth, particularly in the North Island and Cowichan Valley.
What This Means for Buyers and Sellers
October’s data reinforces that Vancouver Island remains a balanced market, which benefits both sides:
For Buyers
- More negotiating power than in a seller’s market
- Steady inventory across key regions
- Slower price growth creates opportunity
For Sellers
- Stable demand across all property types
- Benchmark prices remain strong
- Serious buyers continue to move forward despite higher borrowing costs
Looking to Make a Move on Vancouver Island?
Whether you’re buying or selling, staying informed is essential—especially in a shifting market.
Our team monitors market trends daily to help you:
– Find the right home at the right time
– Price your property competitively
– Understand neighbourhood-specific trends
– Access listings the moment they become available
If you want monthly market updates delivered straight to your inbox, subscribe to our newsletter.
Contact the Scott Parker Real Estate Team to get started.
September 2025 Real Estate Market Statistics
Find your dream home with the Scott Parker team!
Our bilingual experts are here to guide you every step of the way.
¡Encuentra tu hogar ideal con el equipo de Scott Parker!
Nuestros expertos bilingües están aquí para guiarte en cada paso del camino.
Phone: 778-744-0372
Pide hablar con el Equipo de Scott Parker
CONTACT US | SEARCH FEATURED PROPERTIES | MORE ABOUT OUR TEAM
Source: VIREB